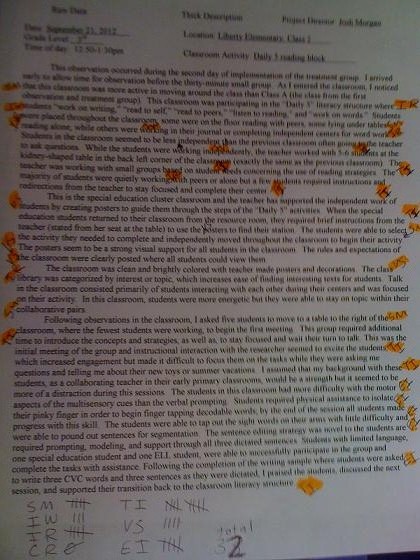
This was my first attempt at coding observational data and it was an interesting experience. The most difficult part was deciding on my categories and I am still not sure they will be beneficial to the research project. I used seven categories: student movement (SM), independent writing (IW), independent reading (IR), class resources (CR), teacher interactions (TI), visual supports (VS), and explicit instruction (EI). The picture below shows my line-by –line coding of the thick description of Classroom B. This was the most time consuming part of the process and I had difficulty deciding which category to place some observations in. I was careful not to “double code” any data to ensure validity but this made it more difficult to decide on a category.
The next photograph shows the sheet and organization I will use to collect coding data from my eight samples including three thick descriptions, two teacher interviews, and three material culture observations. This analysis showed that the majority of observations in the classroom were concerning “teacher interaction.” I found this interesting, especially during a mostly independent work time. I also noticed that I have little observations concerning explicit instruction until I pulled a few students to the treatment instructional group. Looking at this observation it seems that the teacher did not use much explicit instruction; however, she was working with a small group of students at the back of the classroom the entire time, I just did not observe this closely. This made me think of how the biases and interests of the observer can affect the outcome of qualitative data; this is something to be careful of as a researcher.


No comments:
Post a Comment